
TERRAIN ANALYSIS I
These are the most important analyzes that can be applied to any region in the world. It provides invaluable analysis about the area to be studied. With these analyzes, it will enable the determination of the main differences and similarities regarding how superior the regions to be studied in the determined area are from each other and for what purpose the work will be exhibited. It will lead the synthesis map to be created.
BOUNDRIES
ELEVATION
SLOPE
HILLSHADE
ASPECT
WETNESS
SOIL
WIND
HEAT
BOUNDRIES
After selecting the workspace and downloading the data, we can express our project as we wish through the Layer Properties tool. You can specify your designated study area with anything, even with CUSTOM SVG's. We can also show boundries for wild life, coast line, physical or psychological boundries. We can always find the data or create ourselves.
We will study Turkey/Izmir for now.

ELEVATION

Note that the information will be given are not step by step guides. In this section; we will use QGIS (you can use ArcGIS) for our analysis. We need some base knowledge to understand what are the analysis and how to create them. To do so, we need SRTM-30m (The Shuttle Radar Topography Mission data) to create DEM (Digital Elevetion Model).
I will continue to study Turkey/Izmir/Cigli area to demonstrate theese analysis. And the best part is all of them are free. You can get your own data for your study area in https://www.naturalearthdata.com/ as in vector or raster format for your need.

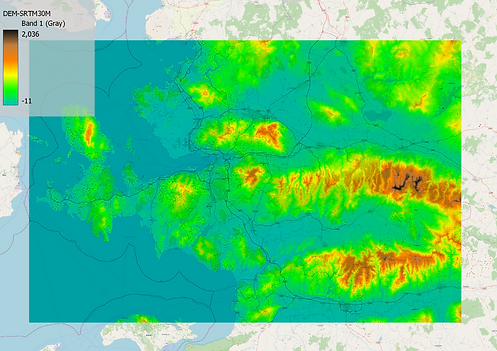
We can create our maps as Raster or Vector for our usage preferences. The vector map above is created with 20m intervals because of the scale of the map. We can also use 12-3-10-100m etc. intervals to fulfill our purpose.
SLOPE
Slope Analysis means a cell map that groups small areas of similar slope together, gridded at a maximum contour interval of 30m(SRTM). The Slope Analysis may depict additional subcategories within said categories: 0-15%, 16-25%, 26-30%, and 30% or greater. It is important for working in the excavation-fill area and for cost analysis.

HILLSHADE
The hillshade function produces a grayscale 3D representation of the terrain surface, with the sun's relative position taken into account for shading the image. Hillshading is a technique for visualizing terrain determined by a light source and the slope and aspect of the elevation surface.
For this example; azimuth of the light is 315 degree and altitude of the light is 45 degree. Note that if azimuth is other than 315, output will not be true or visible.
For the example below, we used elevation and hillshade maps. For a better view, you should try different blending options and find which suits for you.


For the example below, we used elevation and hillshade maps. For a better view, you should try different blending options and find which suits for you.
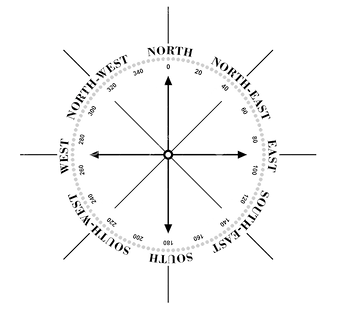
ASPECT
The aspect of terrain refers to the direction it’s facing in. Since this study is taking place in the Northern Hemisphere, properties should ideally be built on a north-facing slope so that they can remain in the sunlight. The detailed benefits of the different aspects will be observed in the synthesis section.
The example below shows an example of usage of maps with blending for clear view.


WETNESS
This map shows the stream collection based on the strahler order. In mathematics, the Strahler number or Horton–Strahler number of a mathematical tree is a numerical measure of its branching. In the application of the Strahler stream order to hydrology, each segment of a stream or river within a river network is treated as a node in a tree, with the next segment downstream as its parent. complexity.
In thıs application, you can follow the hydrologyst Hans van der Kwast and his work for further information.

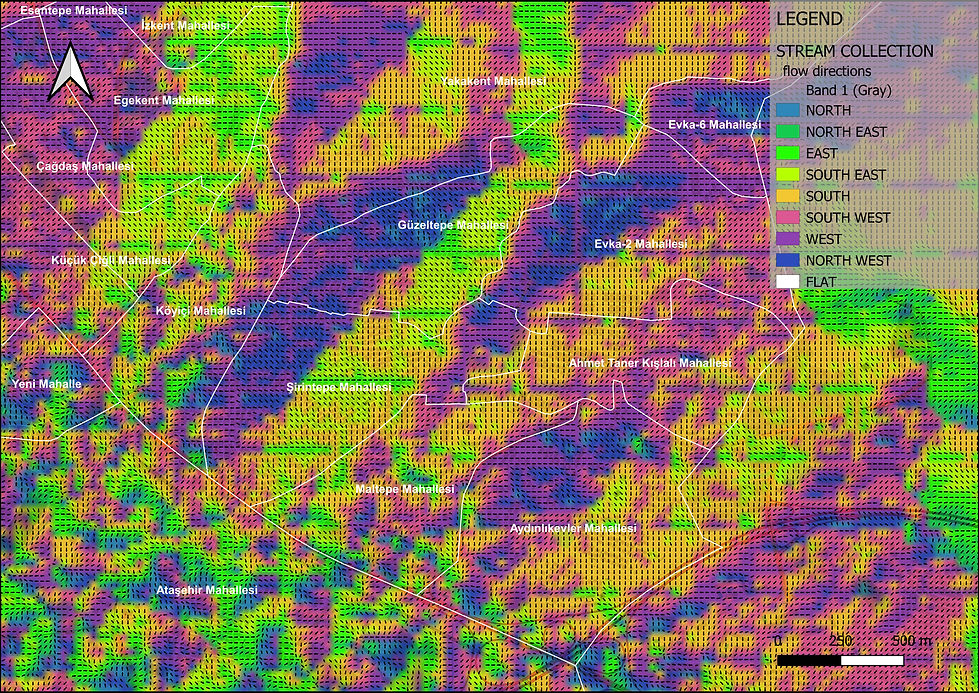
Arrows represent flow directions related to aspect; It provides better understanding of the map.
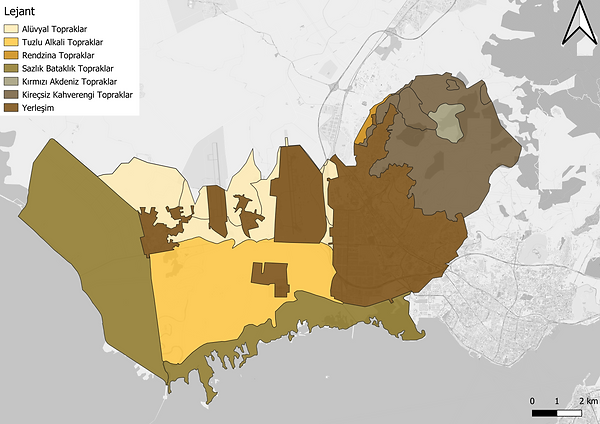
SOIL & LAND USE
Analysis of maps showing SOIL quality is important. It can give sufficient information about vegetation and even fauna.
It is very important that the fertile soil is used consciously and not to be opened for development. It can be examined in detail by considering other criterias during the synthesis phase.
WIND
Hourly grib meteorological information for 16-18 June 2022 is obtained in this image.
This data-set from openskiron, contains important data which are;
-
Wind at 10m (velocity & direction)
-
Surface gusts
-
Pressure corrected to MSL
-
Accumulated precipitation
-
Snow depth
-
Total cloud coverage
-
Relative humidity
-
Surface temperature
-
CAPE
-
Simulated RADAR Reflectivity
-
Significant wave height
-
Swell height
-
Swell direction
-
Swell period
-
Wind wave height
-
Wind wave direction
-
Wind wave period
-
Sea current velocity & direction
.

By comparing the wind directions in the summer months at the top and the wind directions in the winter months at the bottom, the prevailing wind direction analysis can be made according to the data was taken.
For example, for İzmir, there is a summer breeze from the north, north-west and north-east directions (according to the data above).
Considering the 2 winter months below, we can say that it receives intense winds from the south, south-east direction.
we can place landscape and windbreak elements by taking these wind directions into account.
All credits are reserved to Andrew Marsh.
HEAT

Once you have data displayed, you can then optionally overlay a range of comfort information on top of it. This gives more meaning to the data and, especially with detailed hourly weather values, can potentially give some insight into the most appropriate design responses for that climate.
One of the best tools for this is the Givoni-Milne
Bioclimatic Chart, you can click for more information.